Titration Curves
A titration curve is a plot of pH versus the amount (usually volume) of acid or base added. It displays graphically the change in pH as acid or base is added to a solution and shows how pH changes near the equivalence point.
The point at which the color of an indicator changes in a titration is known as the end point. It is determined by the Ka value for the indicator Typically, color changes occur over a range of 1.5 to 2.0 pH units.
The equivalence point is the point at which chemically equivalent amounts of acid and base have reacted.
Ideally, the end point and the equivalence point in a titration should coincide.
Titration of a strong acid with a strong base
Eg. NaOH (aq) + HCl (aq) → NaCl (aq) + H2O (l)
If we look at the titration of a 50.00 mL of a 0.100 mol/L HCl solution with a 0.100 mol/L solution of NaOH.
The pH pf the solution with depend on the concentration (moles H+ in a given volume). As NaOH is added, the moles of H+ will decrease and the volume of the solution will increase. The initial concentration of HCl will determine the starting pH, as well as the maxiumum moles of H+ that are present:
mols H+ = [HCl] x VHCl = 0.100 mol HCl / L x 0.050 L = 0.00500 mol HCl
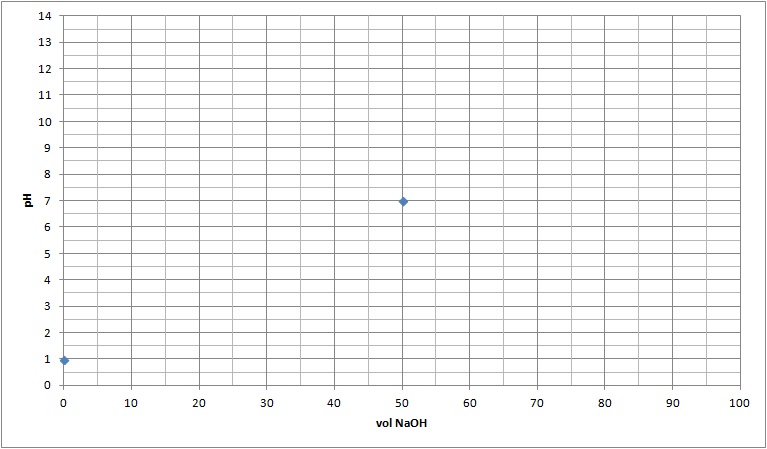
Initital pH = -log[HCl] = -log(0.1) = 1
Vol NaOH
added |
mol NaOH
added |
mol HCl
remaining |
mol NaOH
remaining |
New
[HCl] |
New
[NaOH] |
pH
| Graph |
| 0 |
0 |
0.00500 |
|
0.1 |
|
1 |
 |
At equivalence (wneh the number of moles of H+ and OH- are equal)
This occurs when 50.00 mL of NaOH was added. At this point all of the H+ and OH- reacted to form water. This leaves Na+ (aq) and Cl- (aq) in solution:
Na+ (aq) is the cation of a strong base and does not cause a hydrolysis reaction
Cl- (aq) is the anion of a strong acid and does not cause a hydrolysis reaction
Therefore, the pH of the solution at the equivalency point is neutral as neither ion cause the production of either OH- (aq) or H+ (aq). |
Vol NaOH
added |
mol NaOH
added |
mol HCl
remaining |
mol NaOH
remaining |
New
[HCl] |
New
[NaOH] |
pH |
Graph |
| 0.050 |
0.0500 |
0 |
0 |
1x10⁻⁷ |
1x10⁻⁷ |
7 |
 |
| As NaOH is added after the equivalency point, the pH of the solution will increase. This due to OH- being added to a solution, and the concentration of H+ iscontinually decreasing (Kw = [H+][OH-]. The addition of a large amount of NaOH will allow it to approach the pH of the NaOH solution, but it will never reach this pH as a result of the dilution with the 50.00 mL of HCl. |
Vol NaOH
added |
mol NaOH
added |
mol HCl
remaining |
mol NaOH
remaining |
New
[HCl] |
New
[NaOH] |
pH |
Graph |
0.085 |
0.0085 |
|
0.0035 |
|
0.0260 |
12.41 |
 |
| 0.090 |
0.009 |
|
0.004 |
|
0.0286 |
12.46 |
| 0.095 |
0.0095 |
|
0.0045 |
|
0.0310 |
12.49 |
| 0.1 |
0.01 |
|
0.005 |
|
0.033 |
12.52 |
| Another point of interest is often 1/2 equivalency. This occurs where half of the acid is consumed through the addition of the base. |
Vol NaOH
added |
mol NaOH
added |
mol HCl
remaining |
mol NaOH
remaining |
New
[HCl] |
New
[NaOH] |
pH |
Graph |
| 0.025 |
0.0025 |
0.0025 |
|
0.033 |
|
1.48 |
 |
| |
| Finally, the points can be joined using a smooth curve. |
 |
Titration of aweak acid with a strong base
We willl look at the titration of a weak acid with the Ka of 1.8 x 10⁻⁵. The equation for the tritration will be
Eg. NaOH (aq) + HA (aq) → NaA (aq) + H2O (l)
If we look at the titration of a 50.00 mL of a 0.100 mol/L HA solution with a 0.100 mol/L solution of NaOH.
The pH pf the solution with depend on the concentration (moles H+ in a given volume). As NaOH is added, the moles of H+ will decrease and the volume of the solution will increase. The initial concentration of HA will determine the starting pH, as well as the maxiumum moles of H+ that are present. Although it is a weak acid and will only ionize partially, the addition of NaOH will ultimately cause all of the acid to ionize, therefore causing it to produce a maximum moles of H+.
mols H+ = [HA] x VHCl = 0.100 mol HA / L x 0.050 L = 0.00500 mol HA
The initial pH will be a result of the partial ionizaton of the weak acid:
HA (aq) ↔ H+ (aq) + A- (aq)
By using an Ice table equilibrium expression, and also method of approximation can determine the initial pH.
|
Ka = [H+][A-]
[HA] |
|
HA (aq) ↔ H+ (aq) + A- (aq)
I 0.1 (1 x10⁻⁷) 0
C - x + x + x
E 0.1 - x x x |
Vol NaOH
added |
mol NaOH
added |
mol HCl
remaining |
mol NaOH
remaining |
New
[HCl] |
Initial
[A-] |
pH |
Graph |
| 0 |
0 |
0.005 |
|
0.1 |
|
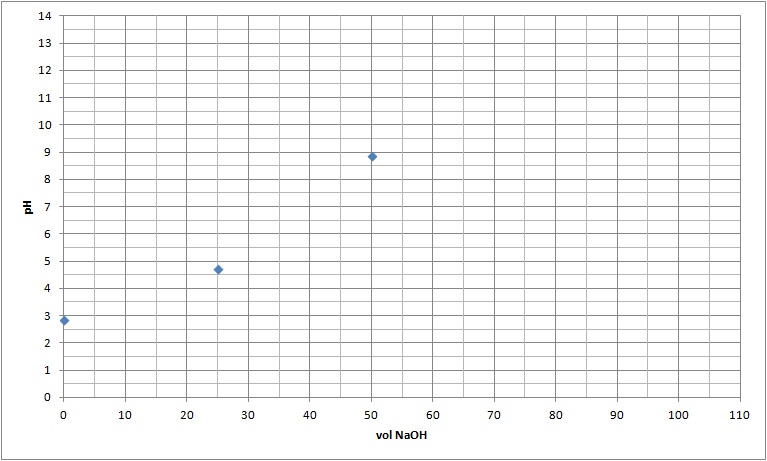
2.87 |
 |
At equivalence (wneh the number of moles of H+ and OH- are equal)
This occurs when 50.00 mL of NaOH was added. At this point all of the H+ and OH- reacted to form water. This leaves Na+ (aq) and A- (aq) in solution:
Na+ (aq) is the cation of a strong base and does not cause a hydrolysis reaction
A- (aq) is the anion of a weak acid and cause a hydrolysis reaction
A- (aq) + H2O (l)↔ HA (aq) + OH- (aq)
|
Kb = [HA][OH-]
[A-] |
To determine the value of Kb for the conjugate base of a weak acid, we use:
Kw = KAKB |
A- (aq) + H 2O (l) ↔ OH- (aq) + HA- (aq)
I 0.1 (1 x10⁻⁷) 0
C - x + x + x
E 0.1 - x x x |
Vol NaOH
added |
mol NaOH
added |
mol HCl
remaining |
mol NaOH
remaining |
[A- ] |
[OH- ] |
pH |
Graph |
| 0.05 |
0.005 |
0 |
|
0.05 |
7.45 x10⁻⁶ |
8.87 |
 |
Unlike a strong acid, half equivalency of a weak acid an important point as at this point [HA] = [A- ] since half of the acid is forced to ionize by the base.
Therefore it simplifies the equilibrium calculation. |
HA (aq) ↔ H+ (aq) + A- (aq)
I 0.033 (1 x10⁻⁷) 0.033
C - x + x + x
E 0.033 - x x 0.033 + x |
Method of approximation allows that the value of x is not significant, therefore [HA] = [A-] = 0.05 mol/L |
Ka = [H+][A-] = [H+] (0.05) KA = [H+] -log KA = - log [H+] pKA = pH
[HA] (0.05) |
Vol NaOH
added |
mol NaOH
added |
mol HCl
remaining |
mol NaOH
remaining |
[A- ] |
[OH- ] |
pH |
Graph |
| 0.025 |
0.0025 |
0.025 |
|
0.033 |
0.033 |
4.74 |
 |
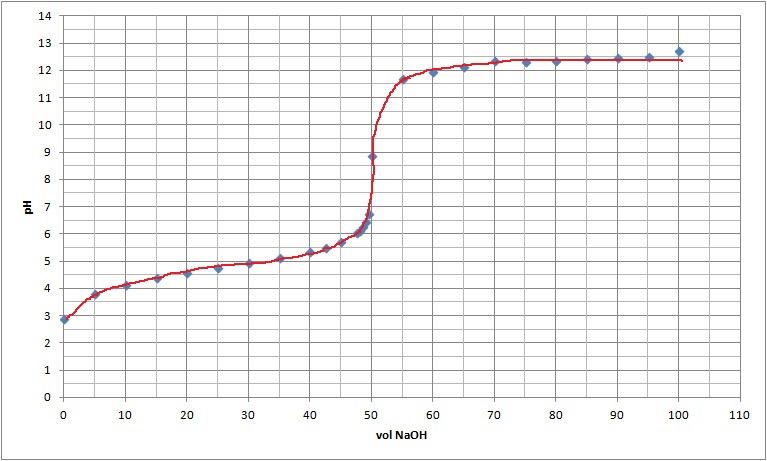
| As NaOH is added after the equivalency point, the pH of the solution will increase. This is due to OH- being added to a solution, and the concentration of H+ iscontinually decreasing (Kw = [H+][OH-]. The addition of a large amount of NaOH will allow it to approach the pH of the NaOH solution, but it will never reach this pH as a result of the dilution with the 50.00 mL of HCl. |
Vol NaOH
added |
mol NaOH
added |
mol HCl
remaining |
mol NaOH
remaining |
[A- ] |
[OH- ] |
pH |
Graph |
| 0.055 |
0.0055 |
|
0.0005 |
|
0.0048 |
11.68 |
 |
| 0.06 |
0.0065 |
|
0.0010 |
|
0.0091 |
11.96 |
| 0.075 |
0.0075 |
|
0.0025 |
|
0.020 |
12.63 |
|
| 0.1 |
0.01 |
|
0.005 |
|
0.033 |
12.70 |
| |
| Now the points can be joined together in a smoth curve. |
 |