The Heating Curve
A system is an imaginary closed container isolated from its environment. It is isolated so that we can investigate how the system changes as it is disturbed either by transferring mass or energy to and from it. The existence of the container is optional in definition, but in reality a container is used for the isolation.
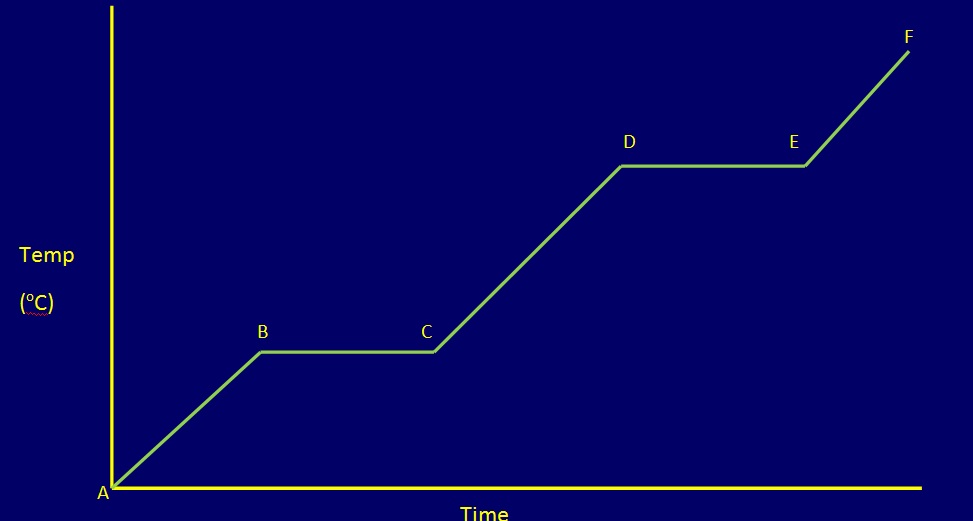
When the system is heated, energy is transferred into it. In response to the energy it receives, the system changes, for example by increasing its temperature. A plot of the temperature versus time is called the heating curve. One such heating curve is shown here.
When a system contains only one phase (solid, liquid or gas), the temperature will increase when it receives energy. The rate of temperature increase will be dependent on the heat capacity of the phase in the system. When the heat capacity is large, the temperature increases slowly, because much energy is required to increase its temperature by one degree. Thus, the slope of temperature increase for the solid, liquid, and gases are different.
For example, the temperature of a system containing ice below its melting point will increase when heated. However, at 273.15 K, the temperature stops rising. At this temperature, the ice start to melt, and the heat is used to melt the ice. The melting of ice is called a phase transition. When energy supplied is used for the phase transition the temperature stays constant. After the phase transition is complete, the temperature rise will follow a different rate than that of the solid due to different heat capacity, as shown in the heating curve.
For one mole of water (18 g), we have the following data:
The heating curve given above is sketched according to the above data. In a real experiment, the heat transferred into the system is hardly at a constant rate unless the heat source is at a very high temperature. However, for the sake of simplicity, let us assume the heat flow into the system to be at a constant rate.
Water is a common substance. Ice is the stable phase below 273.15 K. Both solids and liquids coexist at 273.15 K. When heat is put into the system, more solid will melt. Thus, the temperature does not change. The normal boiling point is 373.15 K. As heat is absorbed, some water will boil off but the temperature is kept at 373.15 K. The changes in temperature as a function of time, or as a function of heat absorbed.
For water, the heat of fusion is 6.0 kJ / mol, and that of vaporization is 40.7 kJ/mol. If the heat input is constant, a longer period is needed for one mole of water to evaporate than the time needed for the ice to melt.
In a laboratory, we heat up different materials and plot the temperature as a function of time. Every material has a unique melting point and boiling point. It also has its heat of fusion and heat of vaporization.
Calculating the Energy Required for Heating
Every time there is a slope change a new q term is required.
When the slope of the line is zero this represents a state change, and the energy required for a state change is calculated according to the following:
q = n∆h
where q is the quantity of heat transferred, n is the moles of the substance and ∆h is the molar enthalpy of fusion or the molar heat of vapourization (depending on the state change that is occurring, liquid or gas respectively).
When the slope of the line of a line is not zero, the energy is used to increase the temperature of the substance. Therefore:
q = mcΔT
Example: Calculate the energy required to heat 150 mL of water from -150oC to 120oC.
 |
qT = q1 + q2 + q3 + q4 + q5 = mc∆T + n∆hfusion + mc∆T + n∆hvapourization + mc∆T
= 4522.5 J + 50.194 kJ + 62130 J + 333.80 kJ + 6030 J = 4.523 kJ + 50.194 kJ + 62.130 kJ + 333.80 kJ + 6.030 kJ = 456.68 kJ |